I am a big fan of Rob Wunderlich’s document Analyzer tool.
If you are a QlikView developer or work for QlikView Center of Excellence(COE) and have application certification and code review process prior to migrating a QlikView application in Prod, this tool is invaluable.
So, in this short article, I want to go over how this tool works and also to go over various sheets that can help you identify potential performance pitfalls and ways to improve performance of your application.
You can download Document Analyzer v3.5 from this link.
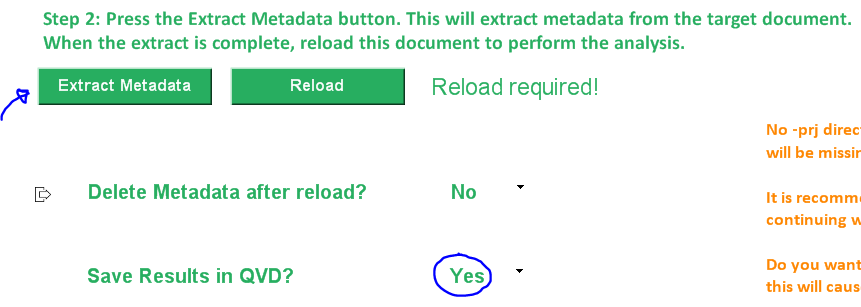
Let’s begin by entering name of the QlikView document to extract metadata.
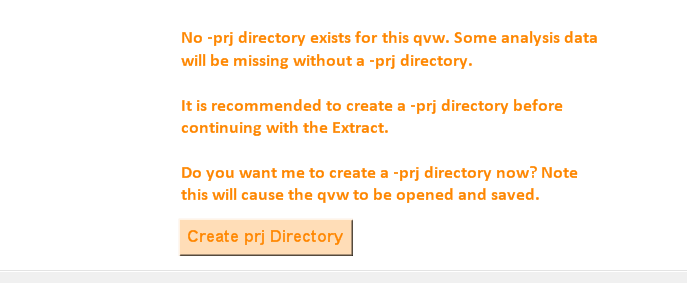
It is recommended to create –prj directory to before the next step. If you are not familiar with prj folder, read this article. It is very useful for source control.
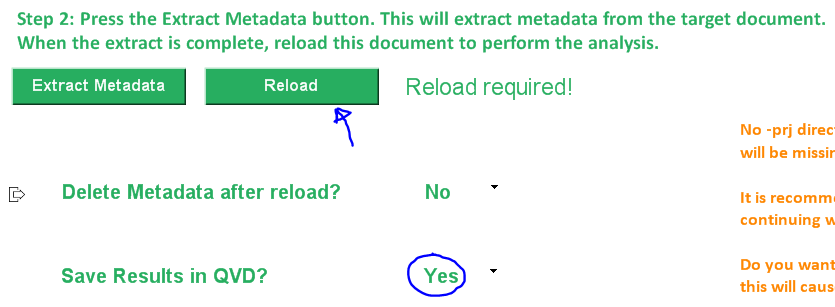
The last step is to reload document. Hit CTRL+R keys or the Reload button to reload the document.
That’s it. Now, it is time to analyze result and to make changes to fine tune your QlikView application.
Let’s start with the summary sheet.
Summary sheet,
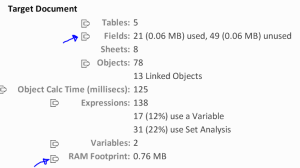
- shows RAM foot print
- % used and % unused fields
- It also allows you to navigate to various sheets to view details.
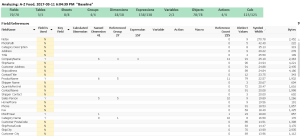
So, let’s start with the fields sheet.
You can export this sheet in excel and work with the business analyst to drop unused fields from your document. Removing unused fields will reduce the RAM foot print and will improve overall performance of your application.
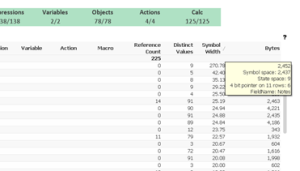
You can also review each field for # of distinct values which will impact symbol space in bytes. If you hover over the last field (Bytes), it also shows you state space and the bit stuffed pointer size for each field.
If you are not familiar with these geeky terms, I highly recommend that you read this article by Henric C.
Symbol Tables and Bit Stuffed Pointers
This article will help you understand how QlikView stores data using symbol tables (AKA fields) and data tables (AKA tables in the table viewer)
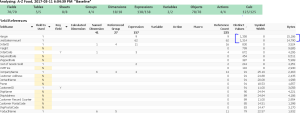
You can sort table by the # of distinct values column and quickly review fields that are likely taking more symbol space.
This is useful not only to remove unused fields but also to review fields with high cardinality so that you can find ways to reduce cardinality.
For example a date time field can be split into date and time fields.
Document Analyzer also provides drop field statement which is very handy should you decide to drop all unused fields. However, a careful review is necessary to make sure that field indeed is not being used in any object.
You can also use Autonumber() function on a long, composite alphanumeric key field. Autonumber() creates a unique integer value for each unique value in the field and thus reduces the symbol space and the overall RAM footprint. But, use it only when you are ready to deploy application in production since you can’t see original value associated with each sequential value assigned.
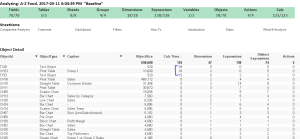
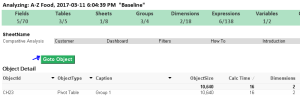
Objects sheet provides chart calculation time in milliseconds. This is very useful to identify culprits to improve your end-user experience.
If you select a single object, a “Goto Object” button will appear at the top that opens the target document and activates that object so you can examine its properties.
CH23:
Next, you can examine memory usage by reviewing memory sheet.
Here you can select Type (field or a table) and sub-type (symbol, internal for field and records for table).
Again, careful review of this sheet provides list of charts that are memory intensive.
Expressions sheet lists all expressions used in the document. This is similar to opening expression overview option from the settings menu.
Here, you can review expressions involving IF statement to evaluate possible replacement.
You can also consider storing expression in a variable if it is being used multiple times. Even though storing an expression in variable may not improve performance, a slight variation of the spelling may void caching of the same expression and thus cost more RAM.
For example, COUNT(ProductID) or Count(ProductID) are considered two separate expressions.
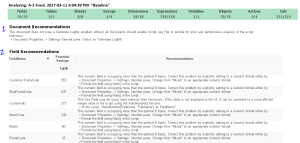
Finally, recommendation page provides additional tips to reduce RAM foot print in addition to obvious mistakes such as not setting ‘generate log file’ in the document properties.
One major advantage of using Document Analyzer is that it is very helpful if you are also required to create a technical design document as part of the project.
In addition, if you save results in QVD, result set gets stored in QVD so that it can be compared against future changes using Document compare tool.
Elsewhere:
Reducing Rows and Columns in Your Qlik Data Model @ LivingQlik
Recipe for Memory Statistic Analysis @ Qlik Design Blog
-Shilpan


