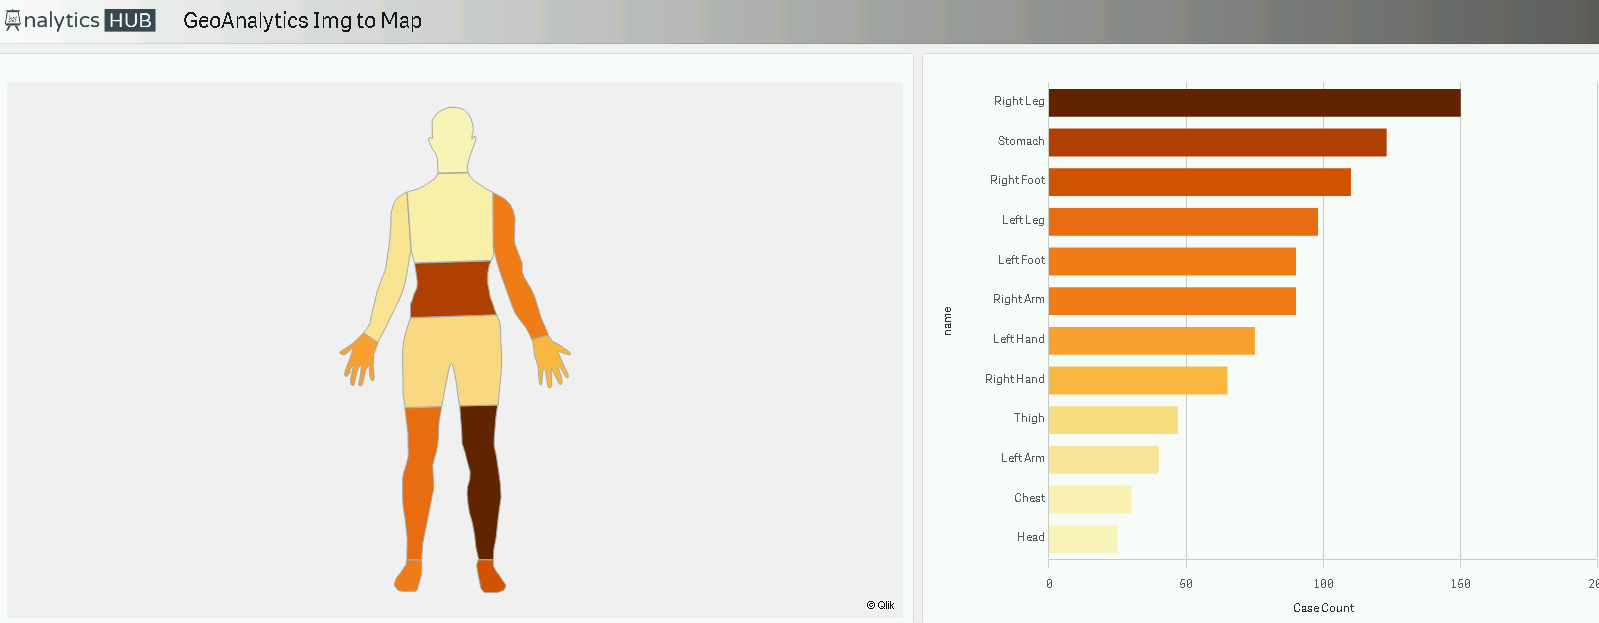
Have you ever wondered how to create a digitized human body map in Qlik Sense to show what individual body parts had the most scans? Or, a warehouse floor plan that shows product inventory?
If so, you are not alone!
Qlik Sense Geo Analytics offers various layers and operations to create a very powerful Geo spatial visualization for your users. Nonetheless, there are times when you want a CAD drawing be used as a digitized map to create powerful visualization combined with equally powerful associative engine.
Using an open source third party tool you can digitize a drawing that can then be used in your Qlik Sense application to leverage yet another brilliant visualization using Qlik Sense Geo Analytics.
Join us on August 17th on a webinar that will teach you step-by-step how to create a body map in less than an hour!
We promise that it will be both educational and fun to join us on our webinar for an hour.
I created this short video to go over basics of Qlik Sense GeoAnalytics with an example to show a map with drill down area and point layers.


Michiel 12:56 pm on August 12, 2019 Permalink
How can I join the webinar?
Shilpan 5:14 pm on October 27, 2019 Permalink
You can watch on-demand webinar if you register
https://zoom.us/webinar/register/WN_P8D2r4QETha5ZBJ_gPyuEQ