Aggr() is a very powerful, advanced aggregation function. You can’t create an expression with nested aggregations without using Aggr() function.
It is a chart function which is akin to Group by clause used in a SQL statement.
Back to Basics:
When you use aggr() function, it involves an inner and outer aggregations:
1. Inner aggregation: QlikView creates a virtual table in memory with the inner aggregation expression.
Example: aggr(sum(LineSalesAmount), Country, SalesPerson)
This expression will create a virtual table with three columns: Country, SalesPerson and Sales
2. Outer aggregation: You can perform additional aggregation on this virtual table.
Example: max(total <Country> aggr(sum(LineSalesAmount), Country, SalesPerson))
This will show maximum sales value by country. Total qualifier is being used to ignore all dimensions except Country.
Obviously, aggr() is resource intensive so before you write your next aggr(), pause and think if you can rewrite expression without using aggr() function.
I thought of few used cases where you can likely avoid using aggr() function.
1. Aggr() function is very useful if you want to write an expression that involves dimensions that are not part of the scope of your chart. That said, if you write an aggr() expression with same chart dimensions, more than likely you may be able to avoid using aggr() function.
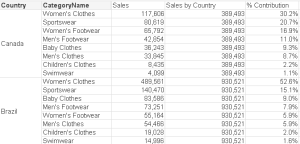
If you need to calculate sales by country and % sales contribution by category, you may try to use your knowledge of aggr() in practice.
sum(total < Country> aggr(sum(LineSalesAmount), Country, CategoryName))
It works but the same expression can be replaced by one without aggr() function.
sum(total <Country> LineSalesAmount)
Since aggr() used chart dimensions, you are better off writing an expression with total qualifier.
Rule # 1: If aggr() involves chart dimensions as inner aggregation with a standard outer aggregation, rethink! You may likely be able to rewrite expression without using aggr() function.
Also make sure that dimensions used in the aggr() function are at finer grain than chart dimensions.
2. Avoid using aggr() function with linear outer aggregation.
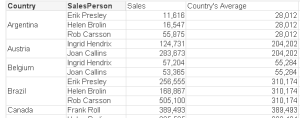
If you have to calculate average sales by country, you have to think of two step process. First, you create a virtual table using aggr().
aggr(sum(LineSalesAmount), Country, SalesPerson)
Then, your perform outer aggregation to get average for each country.
avg(total <Country> aggr(sum(LineSalesAmount), Country, SalesPerson))
Now, think about it. You can rewrite this expression without aggr().
If you’ve guessed it, total qualifier comes handy when you rewrite same expression without aggr().
sum(total <Country> LineSalesAmount) / Count(total <Country> SalesPerson)
Rule#2: Avoid using aggr() involving linear outer aggregation such as average.
-Shilpan


